
Guide · Pillar
Conversion Rate Optimization: The Complete Guide for Performance Marketers
Conversion rate optimization (CRO) is how you get more from the traffic you already pay for. It’s usually the cheapest lever in paid acquisition: raise the conversion rate on the pages behind your ad spend and your cost per customer drops without touching a single bid. This guide covers what CRO is, why the standard playbook breaks down in practice, and what changed now that software can run most of the loop for you.
By Tailor AI team · Last updated July 20, 2026
 Tailor AI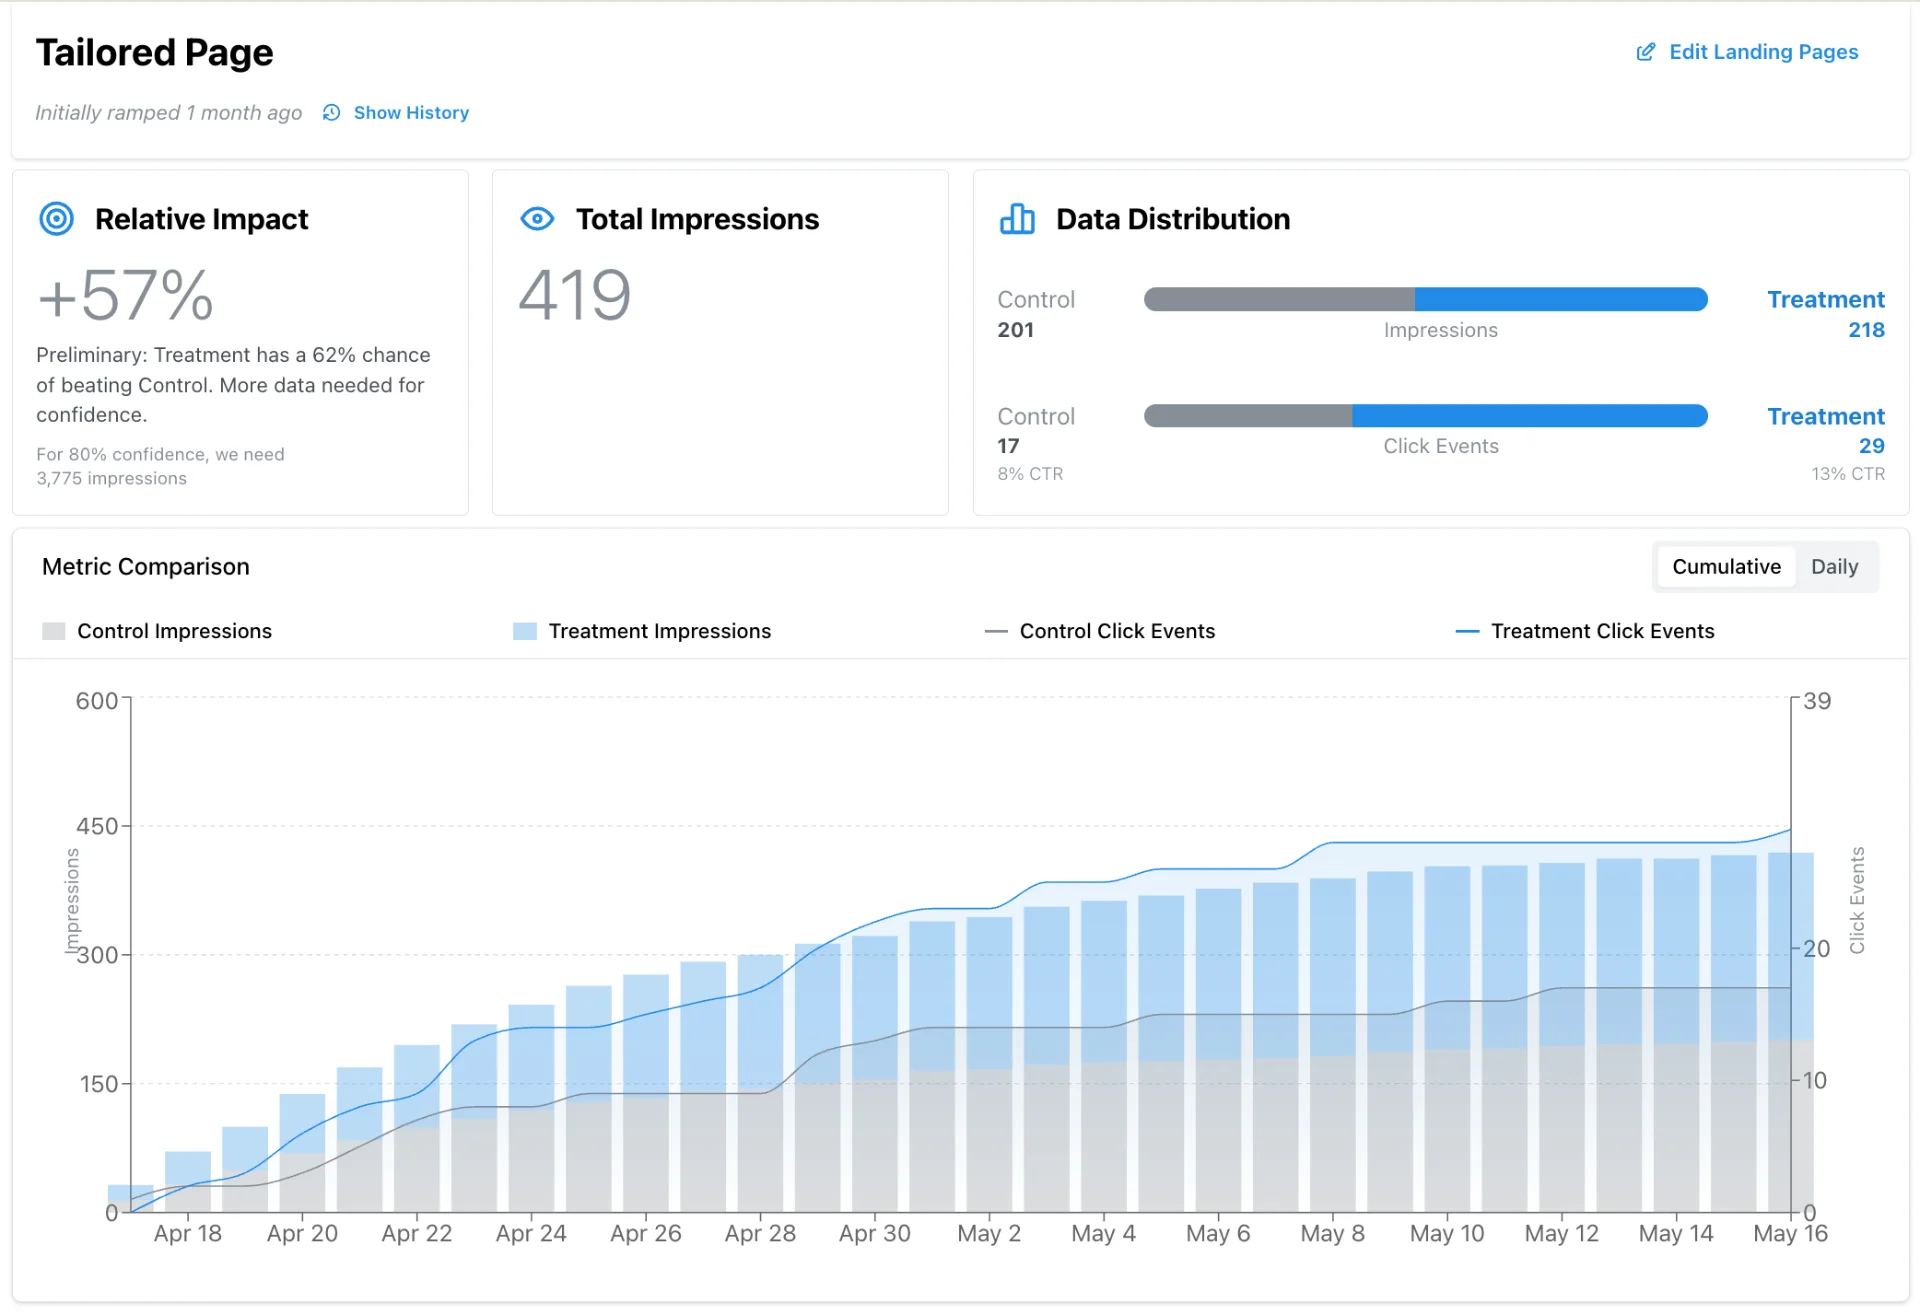
- Who this is for
- Performance marketers, growth teams, and marketing leaders who own conversion outcomes on landing pages and want a practical, current view of how to improve conversion rates.
- Methodology
- Drawn from hundreds of conversations with paid acquisition and growth teams about how they test, what blocks them, and what actually moved their numbers. No invented statistics, just patterns that repeat.
Teams running Tailor






Definitions
What is conversion rate optimization?
Conversion rate optimization means getting more of your visitors to do the thing you built the page for: start a trial, request a demo, buy something, fill out a form, book a call. The conversion rate is just conversions divided by visitors. CRO is moving that number up on purpose, with research and tests instead of guesses.
Two things make CRO different from general “make the website better” work. First, it’s measured: every change is evaluated against a baseline, so you know whether it helped, hurt, or did nothing. Second, it’s focused on decisions visitors are already close to making. CRO does not create demand. It removes the friction, confusion, and mismatch that stop visitors who arrived with intent from acting on it.
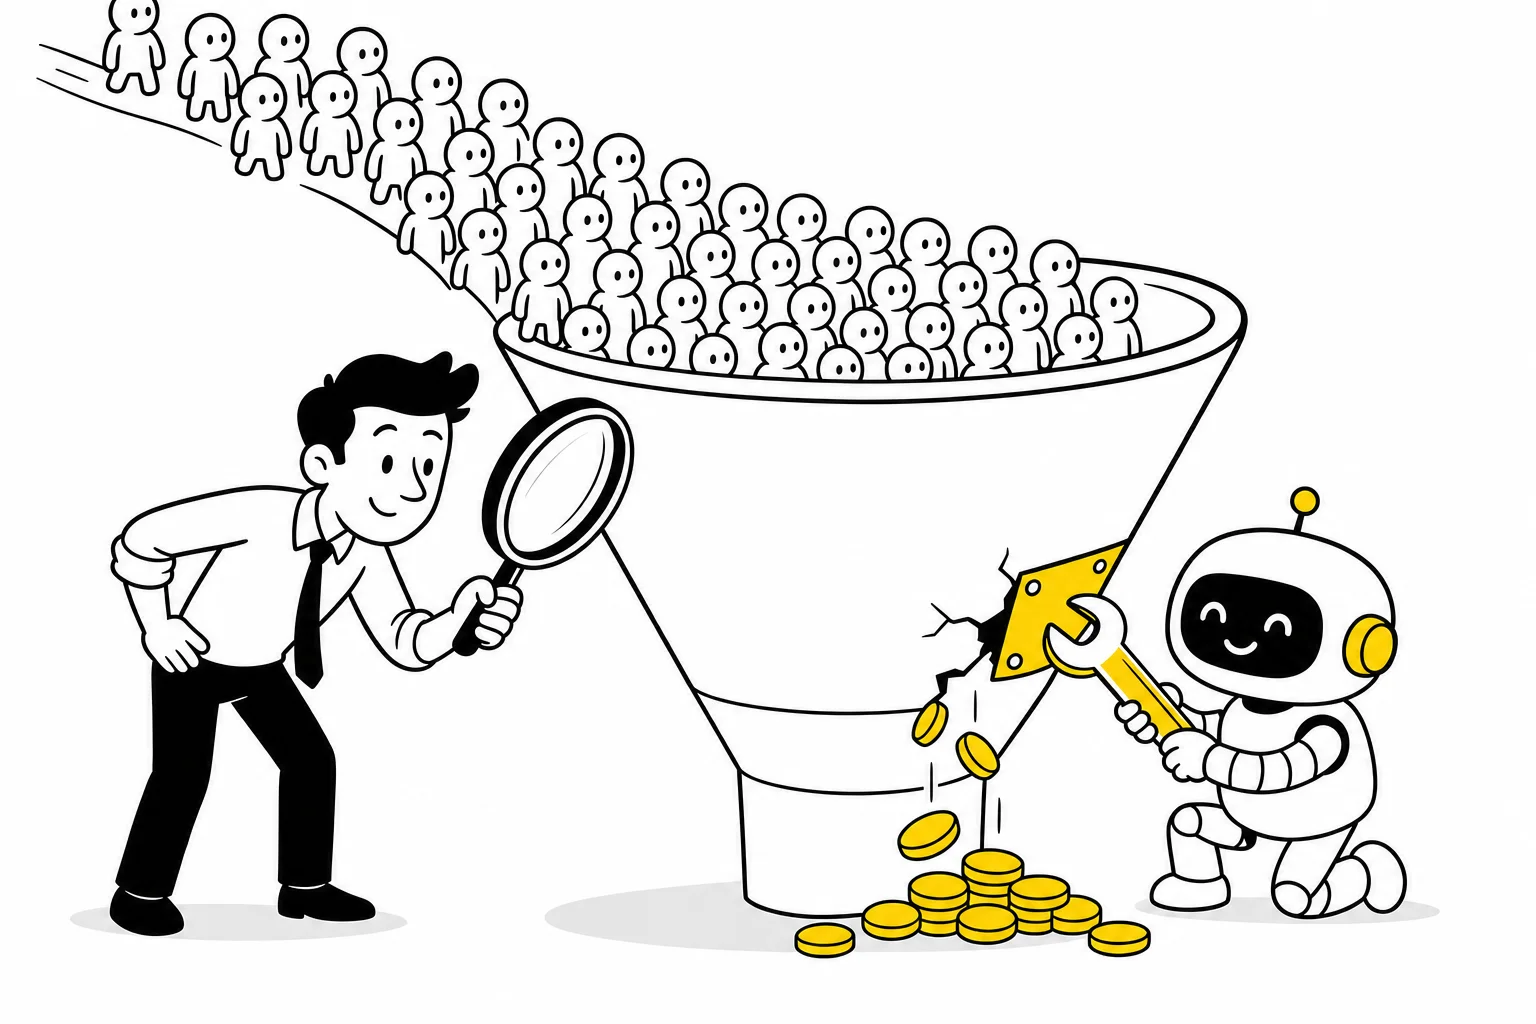
Compare conversion improvements with other ways to reduce acquisition cost.
If you spend money on ads, every point of conversion rate flows directly into your unit economics, which is why landing page conversion optimization is where most paid teams start. Doubling a landing page conversion rate halves the cost per acquisition from that page without changing a single bid. Compare that to the alternatives: squeezing more efficiency out of mature ad platforms gets harder every year, and buying more traffic at the same conversion rate just scales your existing waste. The page is where the upside sits, and it’s the part of the funnel most teams touch least.
What counts as a good conversion rate
Benchmarks are the most requested and least useful part of CRO. Typical rates vary widely by industry and offer: e-commerce purchase rates usually land in the low single digits, lead generation and B2B demo-request rates tend to run somewhat higher because the commitment is smaller, and high-intent branded search traffic converts far better than cold social traffic on the same page. Device matters too: desktop typically outconverts mobile for complex B2B offers, while mobile can win for simple transactional flows.
Use your own segment-level conversion rates as the baseline.
The core argument
Why site-wide conversion rates mislead
Most teams practice conversion rate optimization against one number: the site-wide or page-wide conversion rate. That number is an average across visitors who have almost nothing in common. A visitor from a branded search, a visitor from a cold LinkedIn campaign, and a visitor on a phone in a different country are all counted together, and the average hides how differently each group behaves.
Every signal attached to a visit carries different intent, and each one deserves its own baseline:
- Campaign
- A retargeting campaign and a cold prospecting campaign send visitors at completely different stages. One group needs a reason to come back and commit. The other needs to understand what you do. The same page can't be optimal for both, and their blended conversion rate describes neither.
- Keyword
- Someone searching for your brand name is close to converting. Someone searching a category term is comparing options. Someone searching a problem phrase may not know solutions exist. Three keywords, three intents, one landing page, one misleading average.
- Source
- Search traffic self-selects by typing what it wants. Social traffic was interrupted mid-scroll. Email traffic already knows you. Averaging them tells you your traffic mix more than your page quality: a shift in spend toward social can drop your blended rate with zero change to the page.
- Device
- Mobile visitors face longer forms, smaller targets, and more distraction. A page that converts well on desktop and poorly on mobile shows a mediocre average that flags neither the desktop win nor the mobile problem.
- Geography
- Currency, language, shipping, compliance, and buying norms all shift by region. A strong conversion rate in your home market can subsidize a weak one abroad inside the same average.
- Company enrichment
- For B2B, IP-based enrichment can identify a visitor's company, industry, and size. An enterprise buyer and a solo founder on the same pricing page have different questions, different objections, and different conversion rates. The average obscures which one you're losing.
This is why a “successful” test can still be a missed opportunity. A variant that wins by 5% overall might be winning 30% with paid search visitors and losing with everyone else. Ship it site-wide and you capture a fraction of the available lift while actively hurting some segments. The overall average declared a winner. The segments tell you what actually happened.
The implication for your conversion rate optimization strategy: the unit of optimization is the segment, not the site. Find the best experience per meaningful segment, and the site-wide number takes care of itself. This is also the honest definition of personalized landing pages: not a gimmick bolted onto CRO, but what CRO looks like when you stop averaging away your best insights. For the B2B enrichment angle specifically, see AI landing page personalization.
The standard playbook
The classic CRO process, and where it breaks
The textbook conversion rate optimization process has been stable for over a decade, and the logic still holds:
- 1. Research
- Gather evidence about why visitors don't convert: analytics funnels, heatmaps, session recordings, user surveys, sales call notes, support tickets. The goal is to replace opinions about the page with observations about behavior.
- 2. Hypothesize
- Turn observations into testable statements: because we observed X, we believe changing Y will improve Z for this audience. Rank hypotheses by expected impact, confidence, and effort so the backlog reflects value, not whoever argued loudest.
- 3. Test
- Run controlled experiments, usually A/B tests, so you can attribute the change in results to the change on the page. Decide sample size before you start, resist peeking, and measure a metric that matters.
- 4. Learn and repeat
- Document what won, what lost, and what it implies about your audience. Losing tests that teach you something are worth more than winning tests you can't explain. Feed the learning into the next round of hypotheses.
Where it breaks in practice
These four workflow problems can delay a CRO program.
- The dev queue
- Marketing owns the hypothesis, engineering owns the page. Every test becomes a ticket that competes with product work, and product work usually wins. Test ideas that took an hour to write wait weeks to ship, and momentum dies in the backlog.
- The 2-4 week page cycle
- Teams consistently describe 2-4 week cycles to get a single landing page variant live: brief, design, build, QA, deploy. At that pace a team runs maybe a dozen tests a year on its most important pages. Ad platforms iterate creative daily. The page side of the funnel moves at a fraction of the speed of the ad side.
- Statistical significance on low traffic
- Classical A/B testing needs roughly 1,000 conversions per variant for high confidence. Most B2B landing pages never get there, and per-segment tests need that volume per segment. Teams respond by either not testing at all or by calling tests early and shipping noise.
- Nobody owns the page end-to-end
- Performance marketers are measured on ad metrics they control: CTR, CPC, ROAS. The landing page sits between marketing, design, and engineering, owned fully by none of them. The result is predictable: teams run dozens or hundreds of ad variants into a handful of generic pages that nobody is accountable for improving.
“You've purchased a Ferrari, but you've got a kind of speed limit on it. You're driving this really nice car, but it's a 50-mile-an-hour zone. Effectively you're paying for a lot of headroom that you're not actually using.”
“We will identify the page updates that need to be made, and then the SEO team will approve. And if they're done, then our engineering and designers can go ahead.”
Track the time required to build and launch each test.
See what Tailor would test on your site
Get segment-level test ideas for your own pages in minutes. Or read how A/B testing and analytics works.
What changed
The modern approach: automatic conversion rate optimization
The established CRO category is the entry point. What changed in the last year is that the expensive parts of the loop (research, hypothesis generation, build, launch, per-segment analysis) can now run automatically, with a human approving what goes live. Automatic conversion rate optimization is the same discipline and the same loop, just with the bottlenecks removed.
Tailor’s version of the automatic loop works like this:
- 1. Collect data
- The system watches how visitors from each segment behave on your pages: where they come from (campaign, keyword, source), what device and geography they're on, and for B2B, enriched company attributes like industry and size. This is the research step, running continuously instead of as a quarterly audit.
- 2. Propose tests
- Based on that data, the system proposes specific experiments with the reasoning attached: which segment, which element, which variant, and why it expects a lift. The hypothesis backlog writes itself, grounded in your traffic rather than a brainstorm.
- 3. You approve
- Nothing ships without your sign-off. You review proposed tests, edit the copy or creative if you want, and approve the ones worth running. The human stays in the loop for judgment and brand. The software handles the labor.
- 4. Launch without a dev queue
- Approved tests go live on your existing pages directly, no ticket, no sprint, no 2-4 week cycle. The variant exists as a layer on the live page, so engineering isn't in the critical path and search engines see the original page structure unchanged.
- 5. Learn and repeat
- Results come back per segment, tied to the conversion events you care about. Winners can be promoted, losers retired, and the learnings feed the next round of proposals. The loop keeps running whether or not this quarter's planning cycle remembered CRO.
What stays human in this loop is worth being precise about. You still decide what the brand sounds like, which offers exist, which segments matter to the business, and what a conversion is worth. The system takes the strategy you already have and runs the testing program it implies, faster than any manual process can. Teams that get the most from automatic CRO treat the proposals the way a good editor treats a draft: approve the strong ones fast, kill the off-brand ones without guilt, and pay attention to what the pattern of proposals reveals about their traffic.
Start by checking whether the landing page matches the ad.
If you run paid campaigns and want the single automatic CRO play with the fastest payoff, it is matching the page to the ad. Every ad click arrives with a promise: the headline the visitor just read, the keyword they searched, the creative that stopped their scroll. When the landing page opens with a generic message instead of continuing that promise, visitors bounce, and for Google Ads the mismatch can also depress Quality Score and raise your CPC.
Automatic ad-to-page matching pulls the ad’s message into the page headline per campaign or keyword, so hundreds of ad variants each land on a page that continues their specific conversation, without anyone building hundreds of pages. The full playbook, including channel-specific steps for Google, Meta, and LinkedIn, is in the ad-to-page playbook, and the search-specific version is covered in Google Ads landing pages.
For a comparison of the tools in this space, including where classic testing platforms still make sense, see best conversion rate optimization tools.
Prioritization
What to test first
Prioritize tests using campaign spend, expected impact, and available traffic.
- 1. Headline and message match
- The headline is the highest-traffic element on the page: everyone reads it, and it decides in seconds whether the visitor feels understood. For paid traffic, test headlines that match the ad or keyword against your generic headline. This is the fastest test to build and the clearest to read, which is exactly what a young testing program needs.
- 2. Call to action
- Test the commitment level before the button color. A visitor comparing options may not be ready to book a demo but will happily see pricing or watch a two-minute tour. Match the CTA to the intent of the segment: high-intent branded traffic can take a direct ask, colder traffic converts better on a smaller step.
- 3. Proof
- Logos, case studies, testimonials, and numbers answer the visitor's real question: did this work for someone like me? Test proof relevance, not proof volume. A single case study from the visitor's industry usually beats a wall of generic logos, which is why enrichment-driven proof swaps are a strong per-segment test for B2B.
- 4. Forms
- Every field is a toll. Test removing fields your sales team doesn't actually use, moving optional questions to after the conversion, and multi-step forms that ask for the email early. Forms are where high-intent visitors are lost over details, which makes them cheap wins once the message is right.
- 5. Per-segment variants
- Once you have a site-wide winner on the elements above, stop averaging. Run the same tests per segment: the winning headline for search traffic is probably not the winning headline for retargeting. This is where high converting landing pages actually come from: not one perfect page, but the right variant in front of each audience.
Prioritize message, offer, and proof tests before minor visual changes.
Run a manageable sequence of tests and use each result to plan the next.
Proving it works
Measuring CRO beyond clicks
The fastest way to discredit a conversion rate optimization program is to declare victory on clicks. A variant that lifts CTA clicks by 20% while quietly attracting lower-quality leads is a loss dressed as a win, and sales will eventually say so in a meeting you aren’t in.
A growth lead at a B2B SaaS company gave us a blunt example. They redesigned their homepage to look like a famous minimalist brand, going from one CTA to three. Clicks on the new buttons went up. Their homepage conversion rate on direct LinkedIn traffic fell from about 16% to under 4%. More clicks, fewer customers, and a channel quietly bleeding for months.
Measure the funnel in layers, and push your primary metric as deep as your volume allows:
- Page events (clicks, form starts)
- Fast feedback, high volume, weakest signal. Useful for detecting broken variants quickly and for early reads on big changes, but never the metric you report as a result.
- Conversions (trials, demos, purchases)
- The standard CRO metric and the right primary target for most tests. It's close enough to value to matter and high enough in volume to reach significance in reasonable time.
- Downstream outcomes (pipeline, revenue)
- The metric leadership actually cares about. Per-variant pipeline and revenue take longer to accumulate, but they catch the failure mode conversions miss: variants that convert more visitors into worse customers. Track them per experiment even when they aren't the stopping criterion.
Two pieces of hygiene keep this honest. First, pick one primary metric per test before it launches and judge the test on that metric alone. Secondary metrics are for context and for catching side effects, not for rescuing a losing variant after the fact. Second, make sure UTM parameters and experiment IDs survive the full journey from ad click to CRM record. If the variant label is dropped at the form handoff, you can never connect a test to the revenue it produced, and the whole downstream argument collapses into anecdote.
"Nobody really cares about landing pages because they can't prove the mid-funnel matters."
That quote, from a growth leader, explains why page work gets deprioritized: not because it does not matter, but because its impact was never connected to the numbers the business runs on. Closing that loop (experiment to conversion to revenue) is what earns CRO a permanent budget line. The full method, including how to handle long B2B sales cycles, is in measuring landing page impact beyond clicks. For how Tailor surfaces per-segment results and flags anomalies before they inflate CAC, see performance insights and A/B testing and analytics.
Small numbers
CRO for low-traffic pages
The most common objection to conversion rate optimization is “we don’t have enough traffic to test.” For classical A/B testing at textbook confidence, that’s often true: roughly 1,000 conversions per variant is out of reach for most B2B pages, and per-segment testing multiplies the requirement.
“We used to use standard statistical analysis with a threshold of 95% confidence, but we realized if we wanted to scale, we just didn't have the traffic to justify running tests for 3 to 6 months. So we increased the flexibility of our thresholds and started using a Bayesian model.”
But “can’t reach 95% significance” and “can’t improve conversion rates” are different claims. Low traffic changes the method, not the possibility:
- Test bigger changes. A full hero rewrite that produces a large lift is detectable with a few hundred conversions. A comma-level copy tweak isn't. Go bold where traffic is thin.
- Use Bayesian and directional methods. A statement like an 85% chance that variant B is better is actionable for a reversible marketing change, even though it would not pass a classical significance test.
- Aggregate across similar pages. Twenty product pages with modest traffic each become one well-powered test if you apply the same change across all of them.
- Let ML-based allocation handle the long tail. Automated traffic allocation shifts visitors toward better-performing variants continuously, without a fixed sample size, which is the practical answer for per-segment optimization on low-volume segments.
The worst option is the popular one: doing nothing until traffic grows. Directional data from a small test beats shipping blind, and the segment-level math (how many conversions you need at which confidence, and when automation beats manual testing) is covered in detail in traffic thresholds: when to experiment vs. automate.
FAQ
Frequently asked questions
It depends on your industry, traffic mix, and what you count as a conversion. E-commerce pages converting on purchases usually sit in the low single digits. B2B SaaS pages converting on demo requests or trial starts often sit a bit higher because the ask is smaller. Paid search traffic typically converts better than paid social because search carries explicit intent. The honest answer: your best benchmark is your own baseline, segmented by channel. Compare this month's per-segment rates to last month's, not to a generic industry average that blends businesses nothing like yours.
A/B testing is one tool inside CRO. Conversion rate optimization is the full discipline: researching why visitors do or don't convert, forming hypotheses, prioritizing them, testing them (often via A/B tests), and feeding the results back into the next round. You can do CRO without classical A/B testing (for example, on low-traffic pages using directional or Bayesian methods), and you can run A/B tests that aren't really CRO because they test random ideas with no research behind them.
Less than most people think, but the method changes with volume. Classical A/B testing at high confidence needs about a thousand conversions per variant, which puts it out of reach for many B2B pages. Below that, you can use Bayesian testing, directional testing on big changes, or ML-based traffic allocation that shifts visitors toward better variants without a fixed sample size. The mistake is doing nothing because you can't reach textbook significance. See our traffic thresholds guide for the specific cutoffs.
Automatic CRO is a loop where software does the heavy operational work: it collects behavioral and intent data from your pages, proposes specific tests with the reasoning behind each one, you approve the ones you want, it launches them without developer involvement, and it reports results per segment. You stay in control of what goes live. The system removes the parts that used to take weeks: instrumentation, hypothesis backlogs, dev tickets, and manual reporting.
The headline, specifically how well it matches what brought the visitor there. For paid traffic, that means matching the ad's promise. Headline tests are fast to build, easy to measure, and touch every visitor. After the headline: the CTA (text and commitment level), proof points (relevant case studies and logos), and form length. Prioritize by spend: fix the pages behind your most expensive traffic first.
The first useful signal usually arrives within one to four weeks of launching a test, depending on traffic. The compounding value takes longer. CRO is a program, not a project: one winning test might lift a page, but a steady cadence of tests per segment is what moves blended CAC and revenue over a quarter or two. Teams that treat it as a one-time audit usually see a bump and then drift back.
Not anymore for most companies. Dedicated CRO teams made sense when every test required an analyst to design it, a developer to build it, and a data person to read the results. With automatic CRO, one performance marketer can run a testing program that used to need three or four people, because the software handles proposal, launch, and per-segment measurement. Larger organizations still benefit from someone who owns the program and the decision-making.
Personalization is what per-segment CRO becomes at scale. Instead of finding one winner for all traffic, you find the best experience for each meaningful segment: keyword, campaign, device, geography, or enriched company attributes like industry and size. Personalized landing pages are simply what you get when you run CRO at the segment level instead of the site level.
Related reading
- Best Conversion Rate Optimization Tools
- Ad-to-Page Playbook
- Landing Page Optimization Guide
- Best A/B Testing Tools
- Measure Landing Page Impact Beyond Clicks
- Traffic Thresholds: Experiment vs. Automate
- A/B Testing and Analytics
- Performance Insights
- Google Ads Landing Pages
- AI Landing Page Personalization
Run the CRO loop without the dev queue.
Tailor proposes tests from your traffic, you approve, it launches. Per segment, tied to conversion rate and revenue.