
A while back we wrote about harness engineering: the context docs, skills, and guardrails that let Claude Code work in our repo like a teammate. The centerpiece was a skill called push, which collapsed the eight-ish manual steps between "code works" and "PR is open" into one command.
We were pleased with it. Then we measured it.
Half the time was nobody working
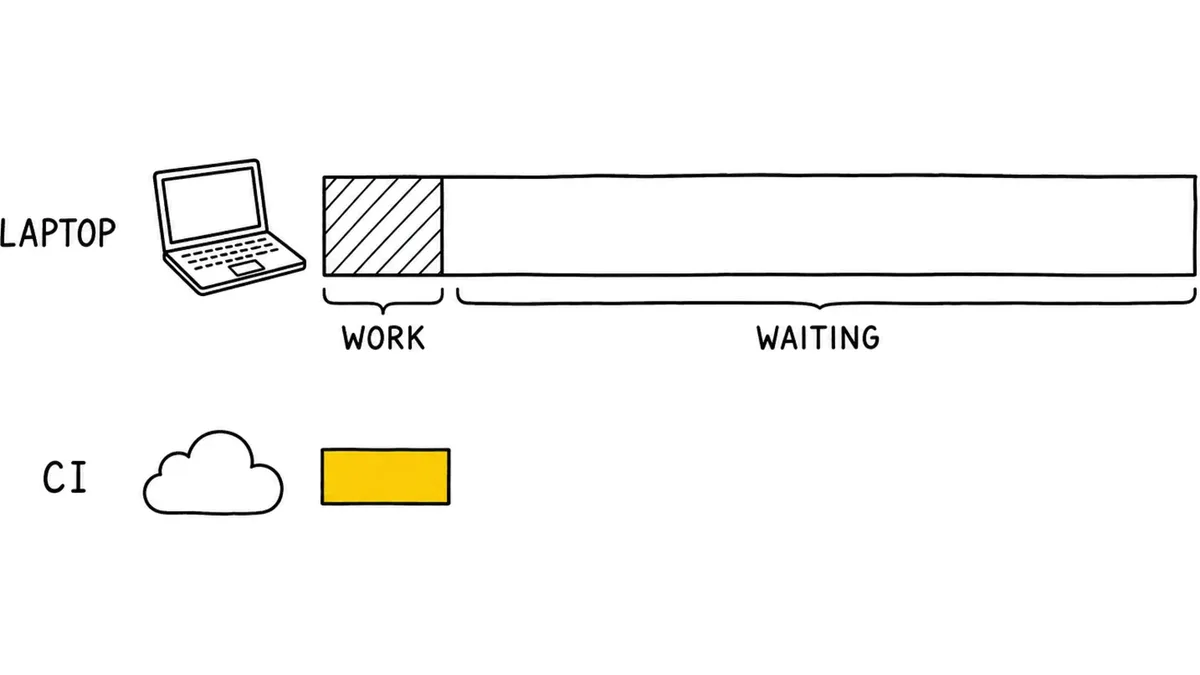
The last recorded run took 14m32s. Actual work was 7m34s of that: code review 4:21, build 1:33, unit tests 0:59, lint 0:24.
The other 6m57s was orchestration. Nothing compiling, nothing testing. Gaps between steps, an agent narrating what it was about to do, a developer watching a terminal.
Two problems in one number. Half the time was coordination overhead. And all of it, including the useful half, ran on a laptop.
Steps in a line that should have been a graph
Push ran build, then lint, then the three unit suites, because that's the order you'd type them.
But lint doesn't depend on build. Neither do the unit tests. They depend on their own upstream lint and test tasks. We'd encoded a sequence where the real constraint was a much shallower graph.
Handing the whole thing to one lage invocation took it from 176s sequential to 83s cold, 55s warm. The long pole is the web build, with everything else finishing inside it.
Satisfying, and small. The real question was why any of it ran on a laptop.
Move it off the laptop
E2e and code review already ran on GitHub. Build, lint, and unit tests had no CI equivalent at all, which is the only reason they were still local.
So we added a workflow running those three as parallel jobs, behind the same selector push already used to decide whether a branch needs checking (a docs-only branch still runs nothing). And a second command, ship: commit, rebase, push, about 30 seconds, nothing verified locally. If something breaks, the workflow comments on the PR naming what broke, because by then the developer has moved on.
14 minutes to 30 seconds, same checks.
That was the easy part. CI then spent a week finding new ways to be the problem.
Three ways CI fought back
The cache that evicted itself
The new jobs need node_modules. GitHub gives you a 10GB ceiling per repo and our entry is 337MB. A per-PR copy written by every PR evicts the entries every other PR reads. Everyone gets a cold install and the cache looks broken.
So the new jobs share the e2e workflow's entry: restore, never save. Which means the cache key is a string that has to stay byte-identical across two files, with nothing enforcing it. There's a test that reads both and asserts they agree. Drift costs a cold install every run with nothing in the log to say why, which is how a bug survives for months.
The green PR nobody could merge
Creating a PR with a label is two API calls. GitHub creates the PR, then applies labels. So the opened event fires with no labels.
Our label check read that payload, concluded there were none, resolved that to "block the merge," and published a failing required check on the head commit. The run that fires when the label lands can't undo it. It publishes its own check run instead of replacing the first.
This looked self-correcting for a long time, because any later push mints a new commit and takes the stale check with it. Then a PR was approved with no further pushes and sat fully green and unmergeable for two hours, with nothing on the page explaining why.
Our first fix re-read the labels from the API with retries. Wrong mechanism. The failure is cancellation, not a missed label: pushes supersede each other, and the superseded run still reached its catch-all and published a failure. Worse, the retries widened the cancellation window from about 5s to about 20s, making it more likely.
The real fix is one line. A superseded run publishes nothing. We deleted the retries and every unlabelled push got 15 seconds back.
CI redoing work that just ran
Push still runs build, lint, and unit tests locally, seconds before pushing. Then CI ran all three again. About 24 runner-minutes per push.
Push now posts a status saying it verified the commit, and the selector reads it and skips. The jobs stay, because a local result is invisible to branch protection and plenty of pushes never go through push at all. Cloud containers can't run the checks and can't claim they did, so they run the full suite. It degrades in the right direction.
Three properties keep the skip honest, each with a test:
- A status is scoped to one commit, so it can't carry forward to a push nobody verified.
- The gate reads the status before the job results, because under the skip all three report "skipped," which is indistinguishable from "never ran." That has to stay a failure.
- The match is exactly "true," not "not false." A failed lookup returns empty, and anything loose reads empty as verified.
Two details worth generalizing
A permissions block is exhaustive, not additive
Ours named contents read and pull-requests write. It didn't name statuses, so statuses was none, so the lookup would have 403'd.
That 403 gets swallowed by the lookup's own fallback and resolves to "not verified" on every run, forever. The feature would have looked implemented, passed review, and never once fired.
Test the mutation, not the behavior
We changed that status match from equals "true" to not-equals "false" as an experiment, and every existing test stayed green. That's the tell a case is untested. It's how the empty-status case got its own test.
A related one we got wrong first: the skip asked for the status once, when the job started, and lost a race. Push can't post it until the commit is on the remote, which lands seconds after the event that starts the workflow. Read once, and a local run that did happen almost always looks like one that didn't. Fully implemented, and it would have essentially never fired. It now polls for about 30s and exits the moment the status appears.
Where it landed
Recent run: selector 41s, then build 406s, unit 373s, lint 257s in parallel, gate 10s. Critical path 457s, and 361s of that is four builds still running one after another. That's next.
The number that matters is the developer-facing one. Pushing went from a 14-minute pause to 30 seconds, and the checks didn't get weaker. They moved somewhere nobody has to watch them.
Measure before you optimize. Half our time wasn't in any step, it was in the gaps between them, and making the steps faster would never have found it.

Written by

Greg Bayer
CEO & Co-founder